In addition, this graph can also be used to adjust the characteristics of the receiving filter to reduce the intersymbol interference and improve the transmission performance of the system.
Connect an oscilloscope across the output of the receiving filter, and then adjust the scanning period of the oscilloscope so that the horizontal scanning period of the oscilloscope is synchronized with the period of the received symbol. At this time, the graph seen on the oscilloscope screen is called an eye diagram.
The signal generally measured by the oscilloscope is the waveform of some bits or a certain period of time, which reflects more detailed information, while the eye diagram reflects the overall characteristics of all digital signals transmitted on the link.
The method of observing the eye diagram is: connect an oscilloscope across the output end of the receiving filter, and then adjust the scanning period of the oscilloscope so that the horizontal scanning period of the oscilloscope is synchronized with the period of the receiving symbol. eye, so it is called "eye diagram".
From the "eye diagram", the influence of intersymbol crosstalk and noise can be observed, so as to estimate the quality of the system. In addition, this graph can also be used to adjust the characteristics of the receiving filter to reduce the intersymbol interference and improve the transmission performance of the system.
How is an eye diagram formed?
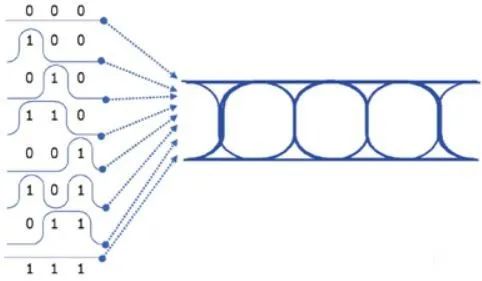
For digital signals, there can be various combinations of high level and low level changes. Taking 3 bits as an example, there can be a total of 8 combinations of 000-111. In the time domain, enough of the above sequences are aligned according to a certain reference point, and then their waveforms are superimposed to form an eye diagram.
As shown below. For the test instrument, the clock signal of the signal is first recovered from the signal to be tested, and then the eye diagram is superimposed according to the clock reference, and finally displayed.
What information is contained in an eye diagram?
For a real eye diagram, as shown in the figure below, first of all, we can see the average rise time, fall time, overshoot, undershoot, threshold level (Threshold /CrossingPercent) and other basic level conversion parameters.
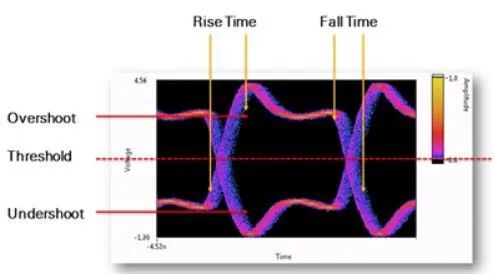
Rise Time: The rise time of the pulse signal refers to the interval between the two instants when the instantaneous value of the pulse first reaches the specified lower limit and the specified upper limit. Unless otherwise specified, the lower and upper limits are set at 10% and 90% of the peak amplitude of the pulse, respectively.
Fall Time: The fall time of the pulse signal refers to the time interval from 90% of the peak amplitude of the pulse to 10%.
Overshoot: Also called overshoot, the first peak or valley exceeds the set voltage, which is mainly manifested as a sharp pulse and can lead to failure of circuit components.
Undershoot: Refers to the next valley or peak. Excessive overshoot can cause protection diodes to work, leading to premature failure. Excessive undershoot can cause spurious clock or data errors.
Threshold level (Threshold/CrossingPercent): refers to the lowest receiving level that the receiver can achieve when the system transmission characteristics are worse than a certain bit error rate.
How to distinguish signal quality from eye diagram conditions?
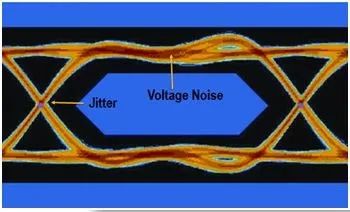
It is impossible for the signal to maintain exactly the same voltage value every time the high and low levels, nor can it guarantee that the rising and falling edges of each high and low level are at the same time. Due to the superposition of multiple signals, the signal line of the eye diagram becomes thicker and blurred (Blur) phenomenon appears.
Therefore, the eye diagram also reflects the noise and jitter of the signal: on the vertical axis voltage axis, it is reflected as voltage noise; on the horizontal axis time axis, it is expressed as time domain jitter. As shown below.
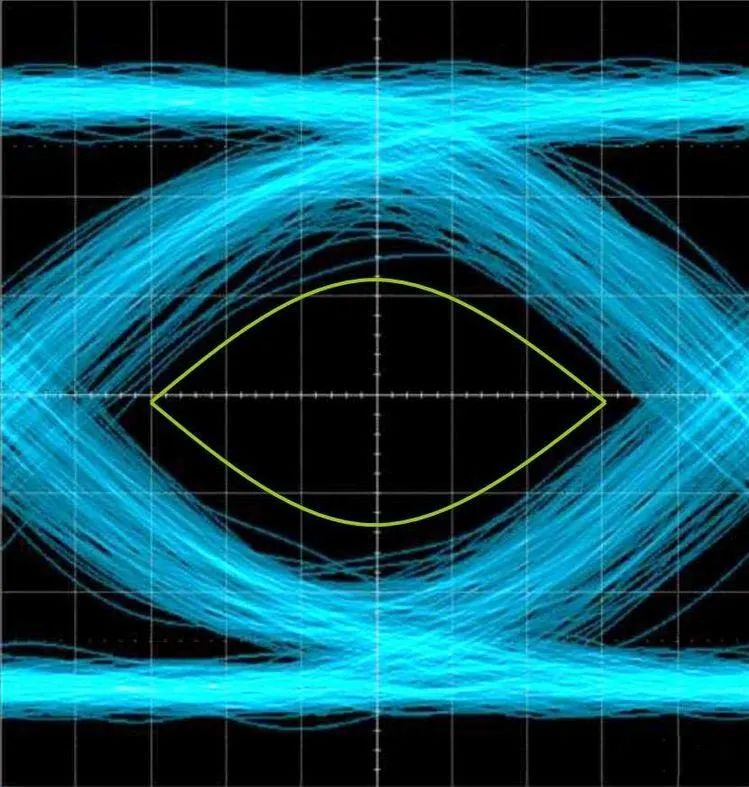
When noise is present, the noise will superimpose on the signal and the trace of the observed eye diagram will become blurred. If there is intersymbol interference at the same time, the "eyes" will open even smaller. Generally, the wider the eyes of the eye diagram, the higher the eye height of the eye diagram, which means the better the signal quality.
Copyright @ 2020 Shenzhen Box Optronics Technology Co., Ltd. - China Fiber Optic Modules, Fiber Coupled Lasers Manufacturers, Laser Components Suppliers All Rights Reserved.